

Are Consumer 'Expectations' Accurate?
Are Consumer 'Expectations' Accurate?
Issue 99

✌️ Welcome to the latest issue of The Informationist, the newsletter that makes you smarter in just a few minutes each week.
🙌 The Informationist takes one current event or complicated concept and simplifies it for you in bullet points and easy to understand text.
🫶 If this email was forwarded to you, then you have awesome friends, click below to join!
👉 And you can always check out the archives to read more of The Informationist.
Today's Bullets:
The Michigan Survey
Latest Results
Michigan's Inflation Track Record
Some Observations
Inspirational Tweet:

You may have heard this past week that US consumer sentiment rose and expectations for inflation fell in the most recent University of Michigan survey.
This, of course, helped embolden investor sentiment and added to brewing enthusiasm which pushed markets to new all-time highs.
But these aren't actual economic numbers, so what exactly are they, and why do investors pay attention to them?
Fair questions to ask, and ones we will answer, nice and easy as always, here today.
So, grab your favorite cup of coffee, and let's unpack and dissect consumer sentiment, with The Informationist.
🤓 The Michigan Survey
First things first, the University of Michigan Consumer Survey is conducted by the University of Michigan's Survey Research Center, which is part of the Institute for Social Research at the University of Michigan. It was developed in 1946, by George Katona, a psychologist and economist at the University of Michigan.
The surveys are conducted monthly and are meant to measure economic and social trends in the United States.
To be honest, when I first arrived on Wall Street about 30 years ago, I was surprised to hear that investors and economists alike relied on this 'data' and other surveys when assessing actual economic conditions.
I soon came to understand there is a method to the madness, however, and we will get to the reasons for that in a moment.
Bottom line, the University of Michigan Consumer Survey has cemented itself as a highly respected source of data on consumer sentiment and expectations.
How it works
The survey is designed to reflect the wide demographic composition of the US, including diversity of income, age, gender, region, and education.
It does this by using what they call a rotating panel design for data collection, where part of the sample is consistent month-to-month plus new participants are rotated into the sample, in order to maintain some continuity while including some fresh input.
The survey's primary focus is on gathering consumer perspectives about personal finances, overall economic conditions, and inflation, and employment.
Pretty much everything that really matters to the average consumer, economically.
To ensure accuracy and relevance of its findings, the data are weighted to correct any over- or under-representation of demographic groups and are seasonally adjusted to account for predictable annual variations.
Much like industry retail sales data and labor department employment measures.
And the U Mich survey is all done by telephone.
They ask a bunch of questions to get insights to how people are feeling about their personal financial situation relative to the past and their general economic outlook on the economy, prices, etc.
The questions might like something like this:
Personal Financial Situation: How do you feel about your current financial situation compared to a year ago? or maybe, What are your expectations for your personal financial situation over the next year?
General Economic Outlook: How do you perceive the current state of the economy? orWhat are your expectations for the economy in the next five years?
Buying Conditions: Do you think now is a good time to buy major household items? Or a house?
Price Change Expectations: What are your expectations for inflation or changes in prices of goods and services in the next year? In the next five years?
Income Changes: Do you expect your household income to increase, decrease, or stay the same in the next year?
This all makes sense and probably gives a pretty solid read on how people are feeling about their situation and what their expectations are personally and for the general economy ahead.
The sample size
One small issue may be the actual sample size that the survey uses to gauge the economic environment as a whole.
How small?
In U Mich's words: We target approximately 420 cases for the preliminary reading, and the final reading typically reflects about 600 observations.
600 people.
Out of approximately 254 million consumers (adults over 18) in the US.
Nothing against University of Michigan, of course, this all takes resources and money and time and effort. The larger the canvas, the larger the cost, of course.
But we need to put it all in context and understand what it means if we are to be making large and important fiscal and investment decisions based around data from surveys like this.
And so, if we were to take an NFL football field and covered it with 254 million blades of grass (one blade per consumer), then the sample size we are talking about equates to about 4 by 4 inches of that football field.
A square so small that you cannot even see it in the graphic below.

Whoa.
This is a teeny, tiny, weeny, whiny sample of the entire population of consumers in the US.
In the graphic above, that's just four pixels out of 6.912 million.
Now, before you simply dismiss the results of the survey altogether, we must first calculate the margin of error of a survey like this.
See how close it is getting us to what the answer would be if we asked every single consumer, all 254 million of them, the same questions.
Doing these calculations, we can assume that by surveying 600 of the 254 million consumers, we will get within approximately ±4% of the actual number.
We can say this with a confidence level of 95%.
In other words, 95% of the surveys should come within 4% (give or take) of the actualconsumer sentiment of the entire nation.
Assuming the sampling remains diverse and representative of the total set of consumers, of course.
OK, so the survey itself may be an accurate, or accurate enough, sampling of consumer sentiment.
So, what did the latest survey tell us? The one that had Wall Street and all the financial television anchors and analysts buzzing for a full day last week?
🧐 Latest Results
Because the survey is an index, it works off a scale that uses 100 as a base value (i.e., a year that consumer sentiment was considered typical or average).
If the index reads above 100, it indicates that consumer sentiment is more positive compared to average, and a reading below 100 means that consumer confidence is lower than average.
Because this is more psychological than scientific, the most important factor is often the direction and rate of change of the numbers from period to period.
For reference, the lowest reading of Consumer Expectations on record occurred in July 1979, when the index fell to 44.2. Likely due to a combination of high inflation and economic stagnation, i.e., stagflation. Consumer confidence, as they say, was in the loo.
In contrast, the highest reading of Consumer Expectations on record was achieved in February of 2000, when the index reached 107.80.
Ah, the Dot Com Bubble. Glory days, indeed.
Until, of course, the bubble burst just a few months later.
Right.
So, where are we today?

Well, the numbers themselves are somewhat benign, aren't they?
Not over 100, and not down in the 50's either.
A lukewarm 70s and 80s.
But look at that rate of change, 13% jump across the board from last month. And over 21% jump from last year.
Digging in a little further, we see that Consumer Sentiment (consumers' thoughts on the economy at the present time) has come quite bit off of its lows of 50, back in June of 2022.
A reading that came in even lower than the 80's, and that is saying a lot.
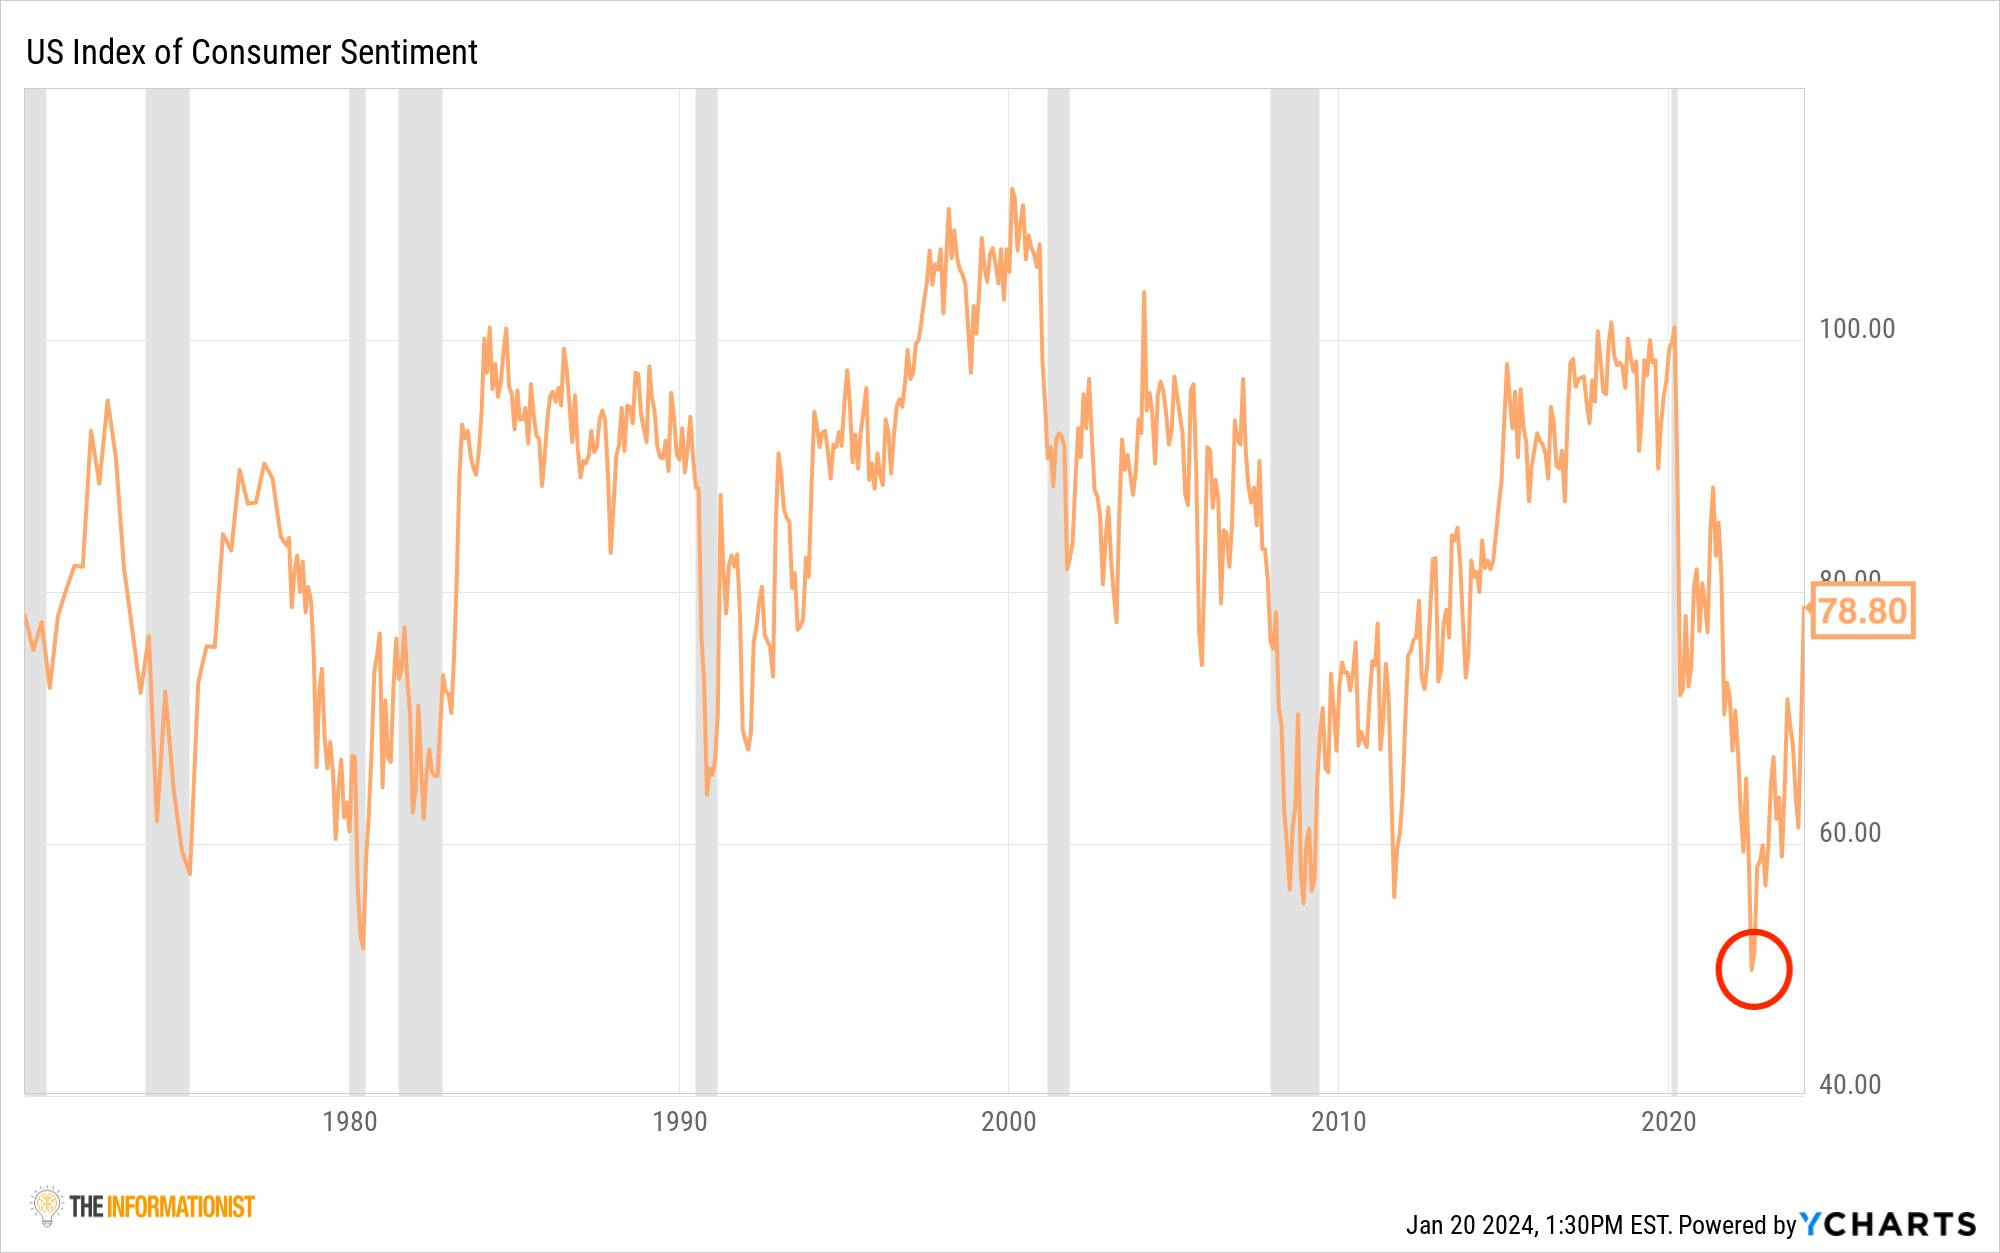
What's interesting is that we had such terrible sentiment at a time that we were not even technically in a recession.
Peeking over at the Current Economic Conditions index, we see a similar development, where we hit the lows of conditions for consumers back in June of 2022 at 52.80.
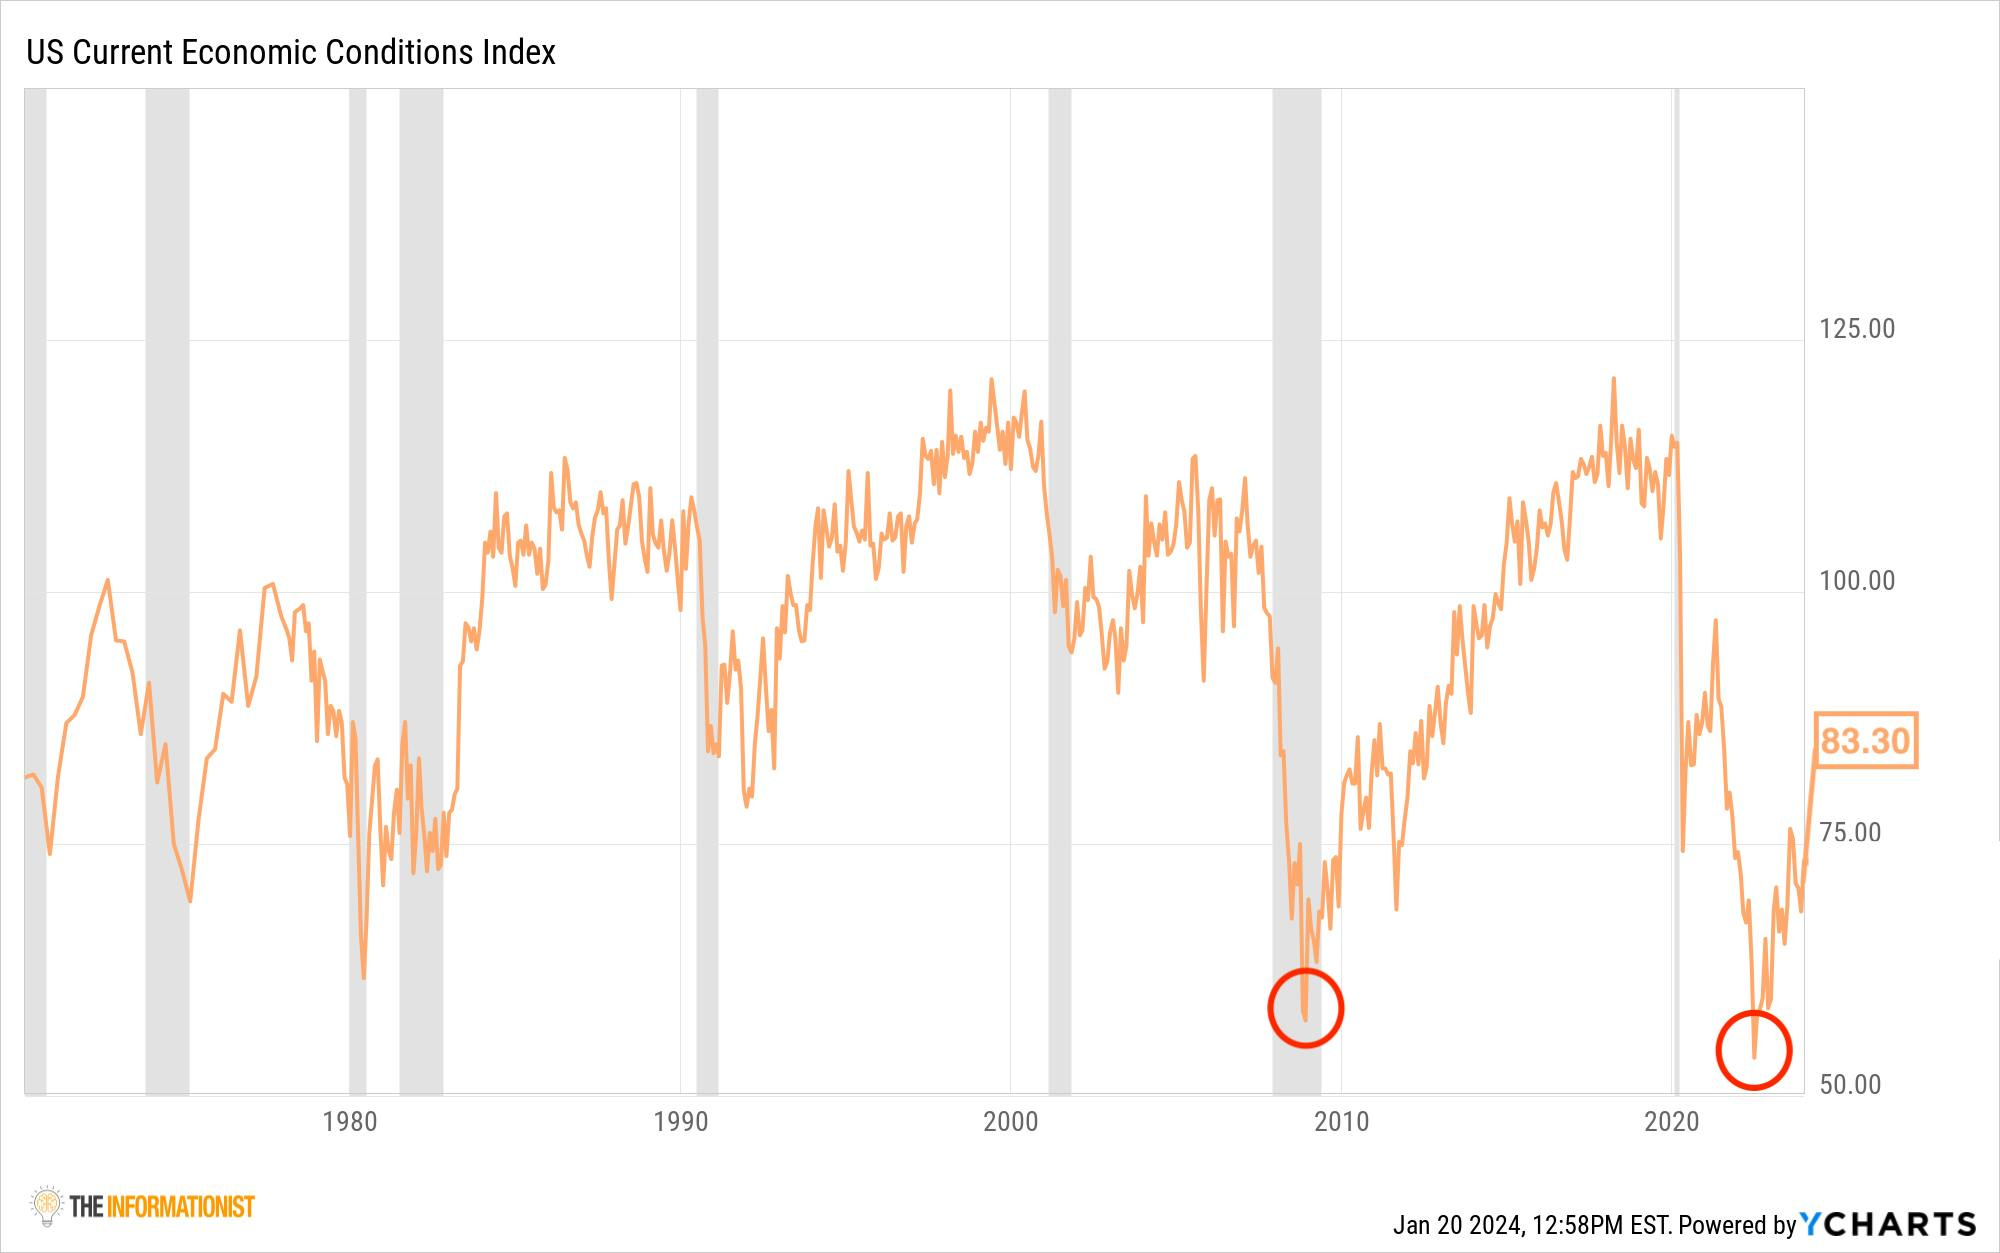
Inflation is a hell of a cloud over the average consumer, after all, and was running at 9.1% back then.
Awful conditions, indeed.
But hey, things are looking up again. The Fed is talking about lowering rates this year, which will ease the pain of taking out a mortgage or buying a new car, and companies have started to actually raise wages to keep up with inflation (not quite, but hey, we'll take it).
Which brings us to Consumer Expectations. This is a forward looking number.
Another jump here, as well, and though the 2022 readings didn't quite reach the lows of 1980, they were every bit as bad as the GFC years, back in 2011/12.
Yet, right back to a 75.90 reading.

So all is groovy, right?
This is what a soft landing looks like, after all, a dip in confidence, some pain, but not so deep that it causes a recession, where people lose their jobs and homes.
Well, take a good look at those charts again, and tell me what you notice.
Exactly.
Confidence and expectations are usually pretty darned high right before a recession actually hits.
Funny that.
But not really funny at all.
🤯 Michigan's Inflation Track Record
There are a couple more readings that the U Mich report puts out, namely inflation expectations. They divide these into two categories: expectations over the next year and expectations over the next five years.
It seems reasonable to ask consumers' expectations about prices.
After all, some studies suggest that inflation expectations can influence actual inflation and economic decisions, creating a feedback loop between expectations and actual inflation rates.
And so, inflation expectations can become self-fulfilling.
How?
Businesses expect higher inflation → raise prices in anticipation → workers demand higher wages → both acts drive inflation higher
Or vice-versa.
This is not the main reason for inflation, of course, that has to do with fiscal irresponsibility of Congress and money printing by the Fed and Treasury.
But people can influence and add to the upward pressure of prices, at times.
Looking at the latest surveys, it appears this is not the current case, as consumers in the survey expect just 3.1% inflation next year and an average of 2.9% over the next five years.
Question is, how savvy is the consumer, and can they actually predict prices, like the psychological cause and effect suggestion above?
Looking at the survey against actual (though admittedly flawed) CPI numbers, it appears the consumer, on average, just parrots what they are being told by the Fed and the media.
I.e., 2 to 3% on average expectation, though this past couple of years did push a bit higher.

But look at how far off the average survey was from reality back in the 2009 GFC deflationary period (nobody believed their home could actually lose value, of course) and the spike in 2021 (who believed that the Fed money printer would cause so much pain?).
And this all makes the 5-year prediction look plain silly.
I mean...

Yeah, pretty much unusable for anything but a verification that the Fed has conditioned people to accept and expect 2 to 3% inflation every single year forever and ever and ever and ever.
And ever.
Sad and absurd.
🤨 Some Observations
Before wrapping up, I believe it is worthwhile to note again that consumer expectations and predictions, while quite useful, can also be quite misleading if not analyzed carefully.
We used to call this skill critical thinking.
Remember, when everyone is in belief that the world is groovy and can get no better (a la 2000), it is time to take a step back from the crowd and assess the situation.
Put simply, this can be a strong and important contrary indicator.
If everyone believes the market is going up, after all, then they have likely already invested their own money to benefit from the expected move.
Leaving no more money to come into the market, of course.
So, I like to watch these expectations for more of a direction and possible reading of a top.
While I do not think we are there yet, I am more concerned with other indicators that could be playing into the increasing expectations, such as the Fed soon lowering rates, home prices (the largest asset on most people's balance sheets) still sky high, and inflation easing.
But I have a hard time being overly optimistic and am cautious at best, due to many other economic factors that most of you have heard name talk about in the past few months.
Namely the markets hitting all-time highs while the Fed has not even begun to lower rates yet.
This is why I remain well-diversified in my own portfolios and can sleep easy at night, confident that my holdings can weather most storms quite handily without giving up too much in the way of gains.
I suggest you do the same.
But, hey, that's me and my outlook.
I strongly encourage you to form your own and invest accordingly.
That’s it. I hope you feel a little bit smarter knowing about the University of Michigan Survey of Consumers and how to read and analyze the results.
If you enjoyed this newsletter and found it helpful, please share it with someone who you think will love it, too!
Talk soon,
James✌️