

Market Multiples and the Magnificent Seven
Market Multiples and the Magnificent Seven
Issue 72

✌️ Welcome to the latest issue of The Informationist, the newsletter that makes you smarter in just a few minutes each week.
🙌 The Informationist takes one current event or complicated concept and simplifies it for you in bullet points and easy to understand text.
🧠 Sound smart? Feed your brain with weekly issues sent directly to your inbox:
Today’s Bullets:
Equity Basics
Market Multiples
Magnificent Seven and Multiple Expansion
Where have we seen this before?
Inspirational Tweet:

Ah yes, if only investing were that easy. Just watch what is going up and jump on board. Buy those stocks and let it ride.
Forget the problems with Cramer and his less-than-stellar stock picking record. This attitude has seemed to permeate throughout the markets recently. A sort of hysteria has taken hold of the NASDAQ.
In particular, there’re a handful of mega-tech stocks that have driven the majority of returns this year.
The Magnificent Seven.
But what are the Magnificent Seven, what is going on with them, and should you, as Cramer advises, ‘stick with them, as it is so darned easy’?
A lot to unpack here, but we will do it nice and easy as always today.
So, grab a big cup of coffee (or tea, if that’s your fancy) and settle in. It’s Informationist time.
Join the Informationist community!
Get access to subscriber-only posts and the full archive
Ask questions and participate in the comments with other awesome 🧠 subscribers!
🤓 Equity Basics
First things first, let’s get you sorted on the basics of stocks and market prices.
If you already know all this, just skip to the next section. But this can be daunting to first-timers, so I want to be sure everyone has a handle on this stuff first.
At the base of it, equity is the ownership of something—in this case, a public company. This ownership is split up into shares.
This can get confusing, though, as when a company goes bankrupt, equity owners (the stockholders) are often left empty-handed, as lenders get paid first.
This dynamic is called the claims on assets, and it’s why bondholders and lenders typically dig much deeper into, are more intimate with, the balance sheet health of a company.
I wrote a whole article about capital structure and claims on assets, recently. If you’re a new investor, I highly recommend you check that out. You can find it here:

Turning back to equity side of things, in essence, a company’s stock price is supposed to reflect the the value of ownership of the business of that company.
In other words, if you own the stock, you own that company’s business, its earnings, and its earnings potential.
It’s a bit more complicated than that, but if you read the article above, you understand the nuance there.
Bottom line, when we look at stocks and prices, we use gauges to determine how over or under valued they may be in the market.
Things like Price to Sales or Price to Earnings ratios, or something called EV to EBITDA.
Let’s pull some of that apart next.
🤑 Market Multiples
Because stock prices also include intangibles, like emotion and momentum and fear and greed, they often trade at prices that appear to be dislocated in the market.
There are all kinds of multiples we can look at when trying to gauge this, but the most common one you hear Wall Street analysts and pundits quote is the Price to Earnings or PE ratio.
We will focus on that here today.
We get this ratio by simply dividing the company’s stock price by the current (trailing twelve months or TTM) or estimated future earnings per share (next twelve months or NTM).
So, if a company earned $2 per share and the stock price is $20, the TTM PE ratio is 10x:
20 / 2 = 10x
You will hear this quoted as, “the company is trading at 12 times earnings.”
But let’s say the above company cuts it’s estimated earnings for next year in half (to $1 per share), then the PE ratio for next year (NTM) will double:
20 / 1 = 20x
It now trades at 20 times earnings.
Simple, right?
But stocks trade at all kinds of ratios depending on the type of business they’re in. So, a bank may trade at an 8x to 10x PE, while a tech or software company can trade over 25x or 50x PE (and much higher, as we will soon see).
This has to do with the expected or potential growth of a company, and perhaps more importantly, the expected speed of that growth. For instance, a software company is typically expected to grow much faster than a bank.
Sometimes, though, the expected part can get a bit ahead of itself.
Call it irrational exuberance or a bubble, this can cause wild swings and sometimes what we call a melt-up in the price of a company or entire segment of the market.
Which brings us to the Magnificent Seven, a collection of companies who have seen their stocks absolutely soar this year.
🤥 Magnificent Seven and Multiple Expansion
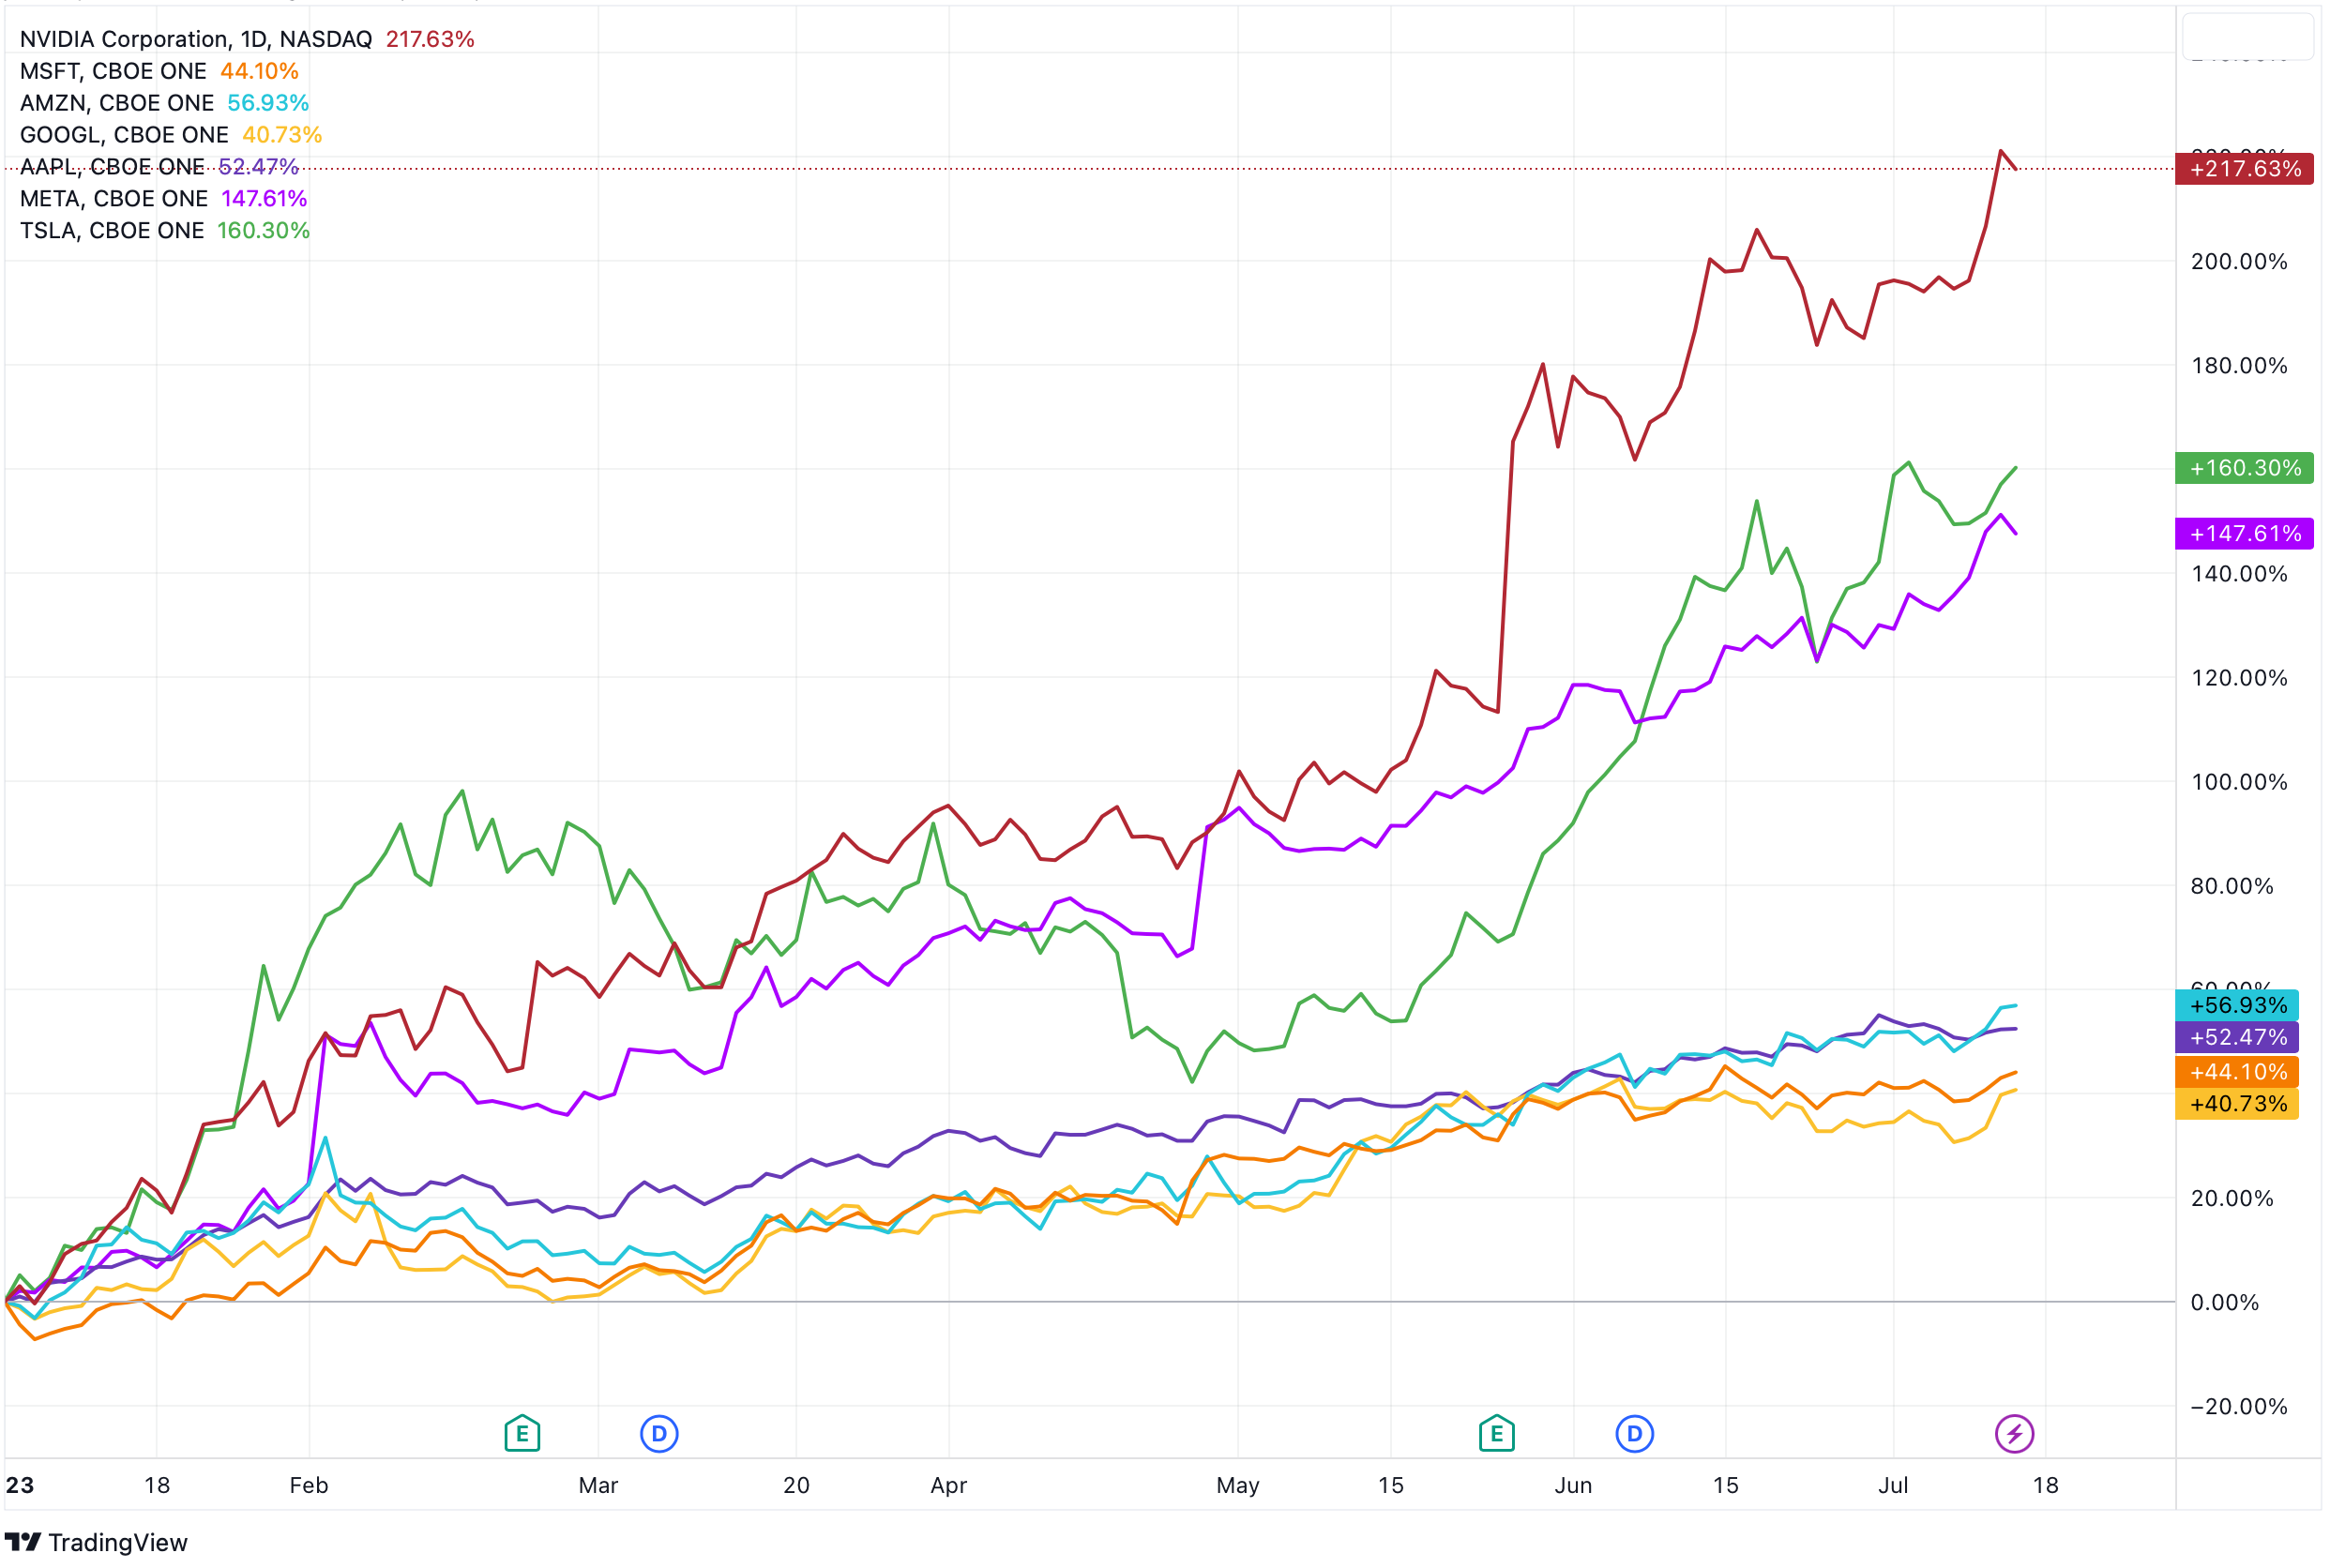
Recently, a small segment of technology stocks have been specifically attached to the Artificial Intelligence revolution. In particular, Apple, Amazon, Facebook, Microsoft, Google, Tesla, and the current AI market darling, Nvidia.
As a result, they have all enjoyed significant fortune in the markets.
So much so, that Bank of America analyst Michael Hartnett dubbed the group of stocks the Magnificent Seven.
I mean, look at their performance this year. On average, they are up over 103%.
In fact, these seven stocks have driven the majority of returns of the entire S&P 500 Index thus far this year:
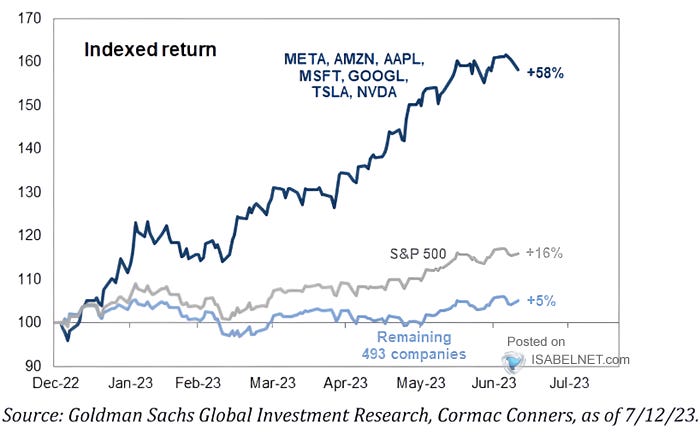
In other words, the Magnificent Seven have driven 11% of the total 16% of returns for the S&P 500 this year, the other 493 stocks contributed the remaining 5%.
That’s more than 2/3’s of the market returns. From seven stonks.
To put this further into perspective, because of the sheer size of these companies, the collective gains this year of these seven stocks would place The Magnificent Seven as the 3rd largest economy in the world.
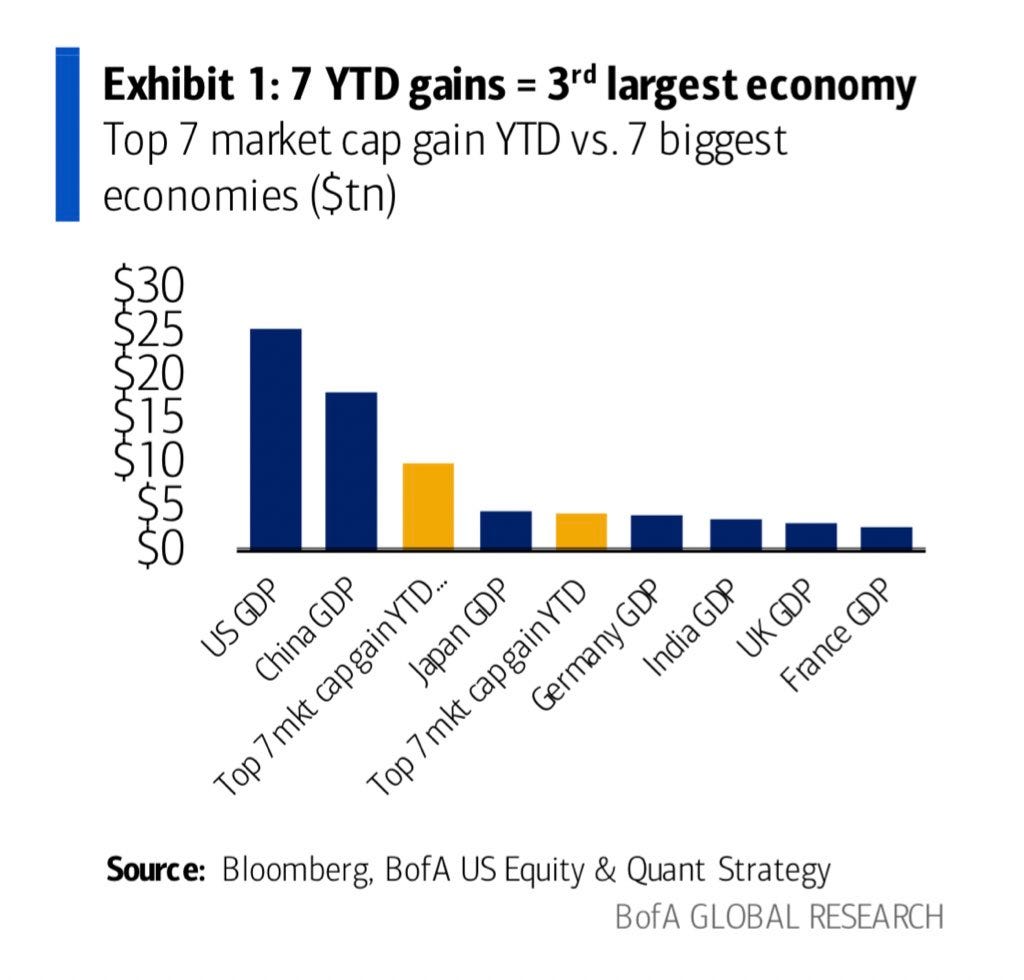
Whoa.
So the next question is, are these stocks tremendously overvalued in the market, or not?
Well, let’s go back to our PE ratio calculations. See what kind of growth expectations the market is attaching to these companies, shall we?
The chart is a little confusing because the scales are on both sides of the charts, but you can see how all (except TSLA) have expanded their PE multiples this year compared to historical PE values.
Remember, the higher these lines go, the more expensive the stock is perceived to be trading.
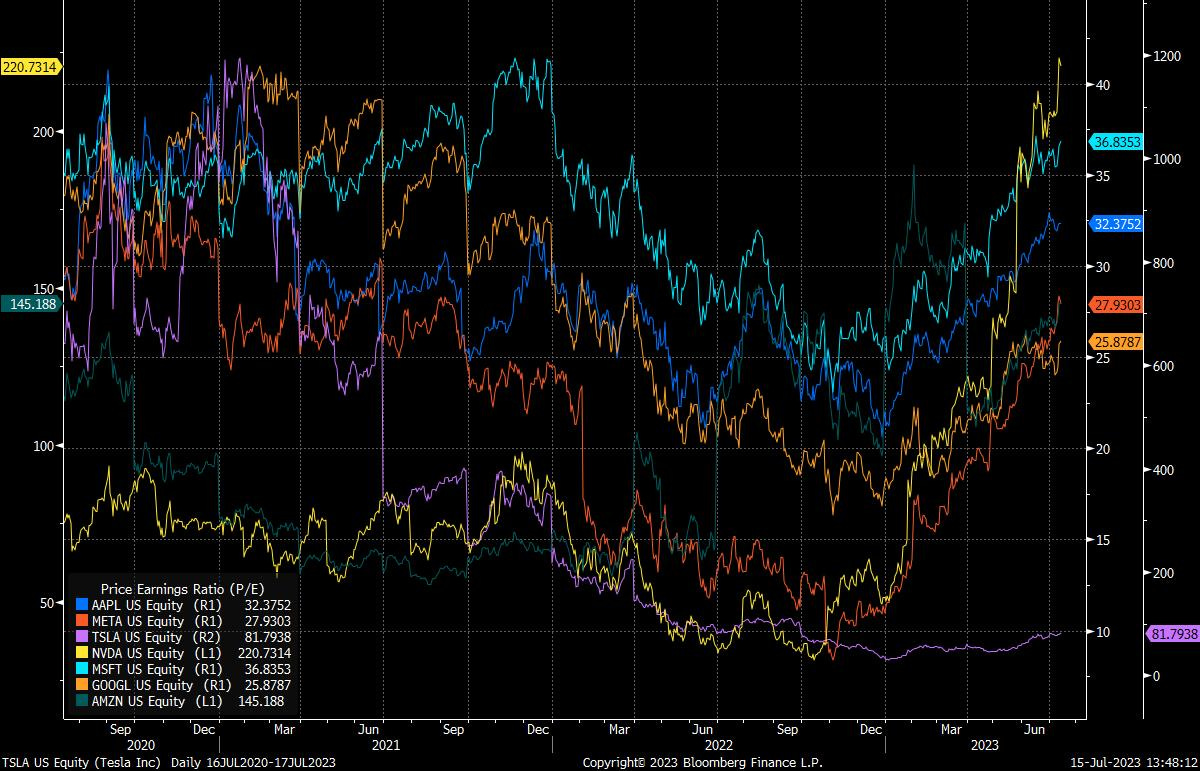
And notice the outlier here: NVDA (bright yellow line, 220.73 PE). About 4x the normal PE ratio for that stock. 👀
You can see how it skyrocketed higher at the beginning of this year. Right when ChatGPT was the new buzz, the bees knees.
Because Nvidia had not yet revised earnings estimates, when the stock exploded higher, so did the PE ratio.
This is called multiple expansion, and it happens when expectations for future earnings rise. (It can also happen when stocks remain elevated even after revising earnings lower).
And if we are truly at the birth of completely disruptive, life-changing technology, then maybe it’s really worth it. Maybe Cramer is right.
After all, AI is projected to touch and affect virtually every single aspect of the entire economy in the future.
Many of them in the immediate future.
NVDA makes the microchips necessary for all that computing power demand.
Seems like a no-brainer, really.
Just buy it here and hold onto it.
Let it ride.
Well, before you go and do that, you may want to consult with the other Magnificent Seven stocks.
Because one of them in particular has been here before.
😵💫 Where have we seen this before?
Some you are old enough to remember the irrational exuberance of tech stocks back in the late 1990’s.
The Internet Bubble.
If you recall, one of those stocks was a new online bookseller called Amazon.
Amazon came public and immediately made noise, threatening to disrupt major bookseller chains like Borders and Barnes and Noble. And then Amazon announced they would expand beyond books and start selling consumer goods and electronics.
The stock took off. I mean, ripped higher.
And everybody wanted some.
Problem is, it got so far ahead of itself, the multiples expanded so dramatically, that it took years for the ones who bought at the end of the exuberant period to ever make their money back.
Exhibit A:
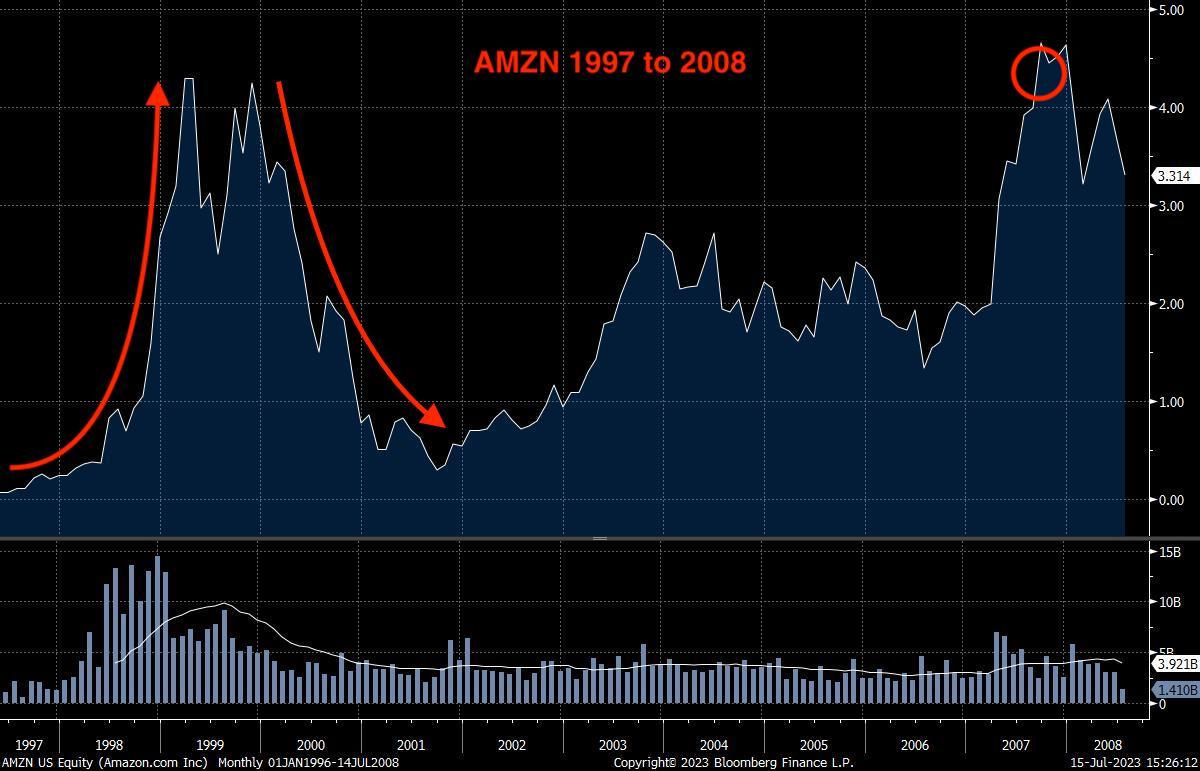
You can see in the chart above, if you bought AMZN in early 1999 and held it into 2000, it took eight years, all the way to 2007, to make your money back.
Of course this was a different time, and circumstances were a lot more powerful around the whole Internet craze, but the echo is there for the AI segment of tech.
Now you may be thinking, well, Cramer is the perfect contrary indicator. If he says to buy and hold, we should be shorting NVDA here!
Well, it certainly seems that NVDA, in particular, has gotten waaaay ahead of itself.
But take another peek at that AMZN chart. Notice that first arrow? The parabolic shaped one?
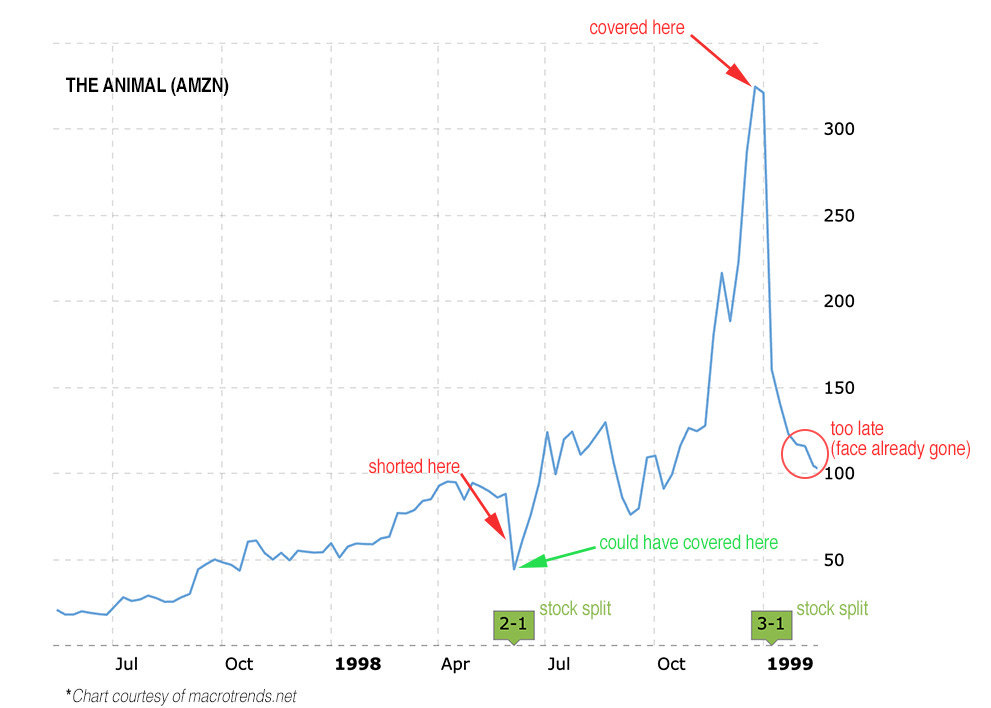
See, I was working for a hedge fund during that time, and one of the managers shorted AMZN, and kept shorting it. If you have not yet heard that story, you can read all about it here:

Long story short (🤨): the manager got his face ripped off.
Exhibit B (oops):
Now. Do I believe in Magnificent Seven?
I do. I believe these are excellent core holdings for long-term portfolios.
But I personally would not be buying NVDA here. I would be waiting for some of the air to come out of that balloon.
Would I be shorting?
Well, as extreme as this melt-up seems, it can keep melting.
Higher. And higher.
And higher.
So, no. I won’t be shorting here, either. I happen to like my face attached to my skull.
And if you like your face, I would be wary of shorting here, too.
Because, as the saying goes, sometimes the best action is no action at all.
That’s it. I hope you feel a little bit smarter knowing about equity multiples and the Magnificent Seven. Before leaving, feel free to respond to this newsletter with questions or future topics of interest.
And if you are a paid subscriber, don’t forget to leave a comment or answer a comment in our awesome 🧠 Informationist community below!
Talk soon,
James✌️
I loved this one! Would love to see you do more targeted analysis of different markets and as it’s interesting to see how you break it down and think about it. Probably like most people I watch these stocks all the time wondering whether to buy them (especially when META was was close to PE ratio of 10), but I convince myself I have no business buying individual stocks other than for the fun and education of it!
Nice article James. Not being a finance guy, I have a question- if forward PE is significantly less than trailing, what does that imply? For example AMZN p/e is currently 320 trailing, 85 forward. Does that mean the market expects the stock (or EPS) to drop, implying it's expensive? Cheers